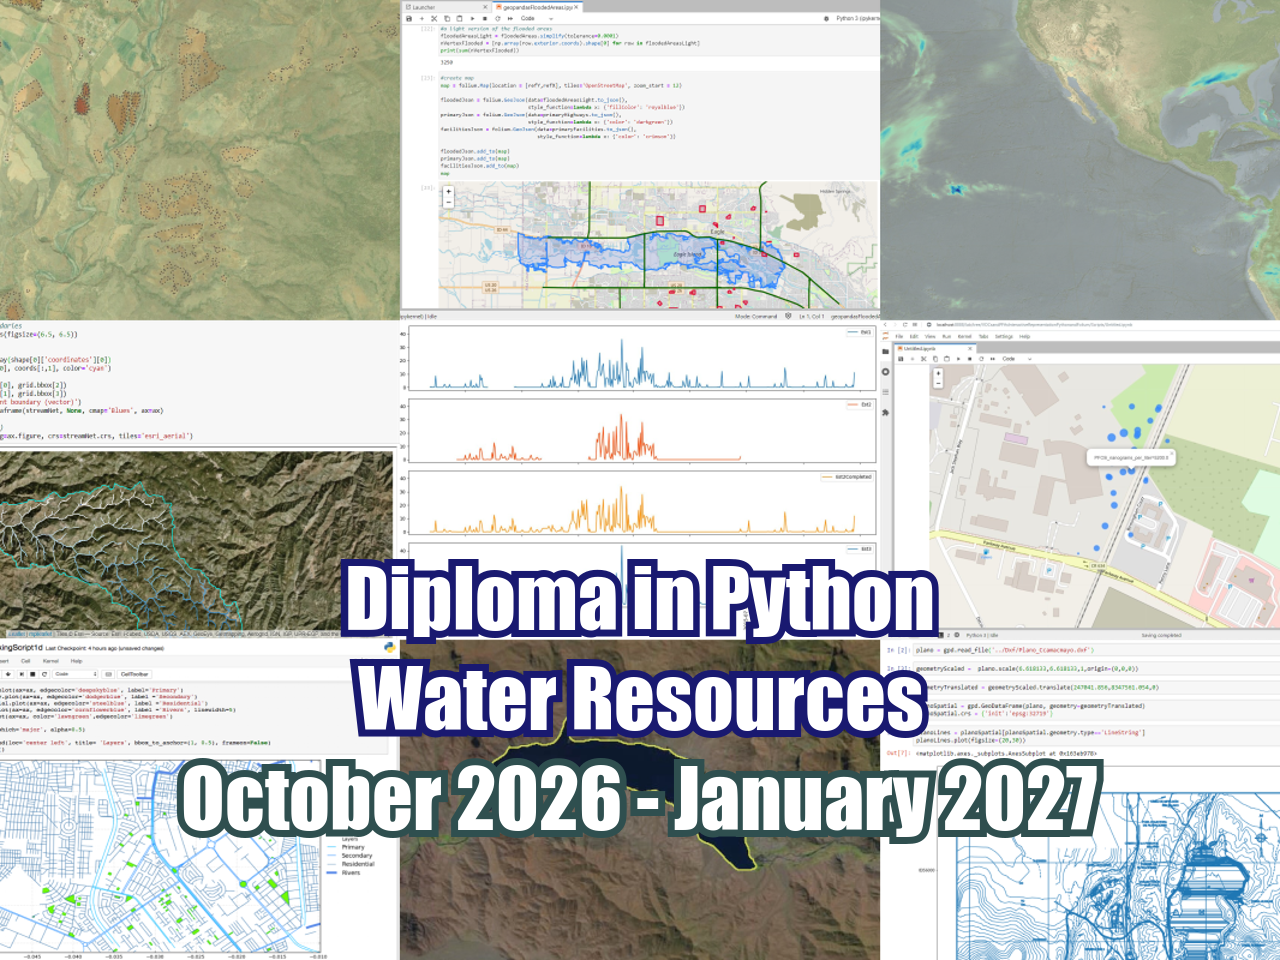
Python has become an essential tool for water resource analysis due to its versatility, powerful libraries, and ability to handle large datasets efficiently. In the field of hydrology and water management, the need for accurate modeling, prediction, and visualization of water resources has grown significantly. Python's libraries, such as Pandas for data manipulation, NumPy for numerical computations, and Matplotlib or Plotly for data visualization, offer robust frameworks for analyzing complex hydrological data. Additionally, Python's geospatial libraries, like GeoPandas and Rasterio, enable the integration of geographic information systems (GIS) for spatial analysis, which is crucial for understanding water distribution, flow patterns, and watershed management.
Hatarilabs presents its educational program designed for mastering Python in real professional and academic environments. The program includes extensive practical work that goes from the basic concepts of Python, Numpy and Pandas to specific applications in water resources and geosciences coupled with geospatial analysis and machine learning.
Objectives
This diploma is designed to provide you with the following capabilities:
- Master the basic concepts of Python and the Jupyter environment
- Become proficient in the common tools of the scientific oriented Python packages as Numpy, Pandas and Scipy
- Create full feature data visualizations for tabular, geospatial and 3D data.
- Learn and apply the most common geospatial tools for vector and raster data analysis in Python
- Have a perspective on the application of machine learning tools in Python for water resources and related fields.
Content
The diploma is divided into 5 modules, each module is divided into 4 sessions.
The content of every module and description of every session is described below:
Module 1: Python for Hydrology - Part 1
This module develops the basic concepts of Python programming under Jupyter. Exercises will cover the basic Python data structures, conditional statements, loops coupled with an introduction to array manipulation in Numpy, tabular data management with Pandas and applied exercises with precipitation data.
Session 1: Python data types
Understanding the way Python works and exploring the numerical types together with mathematical operations. Strings and boolean expressions are also reviewed.
- Lexical and syntax analysis.
- Types and objects (strings, list, tuples and dictionaries).
- Expressions and operators.
- Conditions and iterations.
Session 2: Python loops and data structures
A review of the conditional forms and functions in Python with practical examples of creation, indexing and management of lists, tuples, dictionaries and sets.
- Lists.
- Functions.
- Loop with while and for.
- Dictionaries.
Session 3: Numpy and matplotlib for water resources
This session covers the key concepts of multidimensional arrays management with Numpy together with applied examples of data visualization with Matplotlib.
- Numpy array creation
- Operation with numpy arrays
- Indexing and redimension of numpy arrays
- Introduction to data visualization with Matplotlib
Session 4: Precipitation data analysis with Pandas
Exploration of the Pandas library for the analysis and management of data in tabular format, review of the available operations among columns, creation of dataframes and export options.
- Read data from text and excel files.
- Filtering temporal series
- Columns and rows manipulation
- Export dataframes to other formats
Module 2: Python for Hydrology - Part 2
Once we have covered the basic concepts of Python programming and introductory examples with water resources data we will move to more specific precipitation statistics with Scipy, analysis of long term precipitation and streamflow data with temporal queries and spatial interpolations for storm events.
Session 1: Rainfall statistics with Scipy I
This session will develop regression analysis over rainfall data, develop statistical distributions for different climate stations, and calculate rainfall values for different return periods.
- Regression analysis for rainfall
- Statistical distributions for precipitation
- Determining returning periods for rainfall
Session 2: Rainfall statistics with Scipy II
Examples of linear interpolations, evaluation of correlation among variables, determination of correlation factors and analysis of confidence intervals.
- Data linear interpolation
- Correlation analysis and coefficients
- Confidence intervals
- Multivariate frequency distributions
Session 3: Precipitation and streamflow data analysis and visualization
This session covers example scripts of long term precipitation and streamflow data collection, filtering, visualization and correlation analysis.
- Historical analysis of precipitation
- Analysis of streamflow and rainfall relationship
- Precipitation based calculations
- Double axis precipitation and streamflow visualization
Session 4: Spatial interpolation of precipitation data with Python and Matplotlib
Example of measured precipitation analysis registered over the Tropical Storm Ida in the state of Louisiana, US. Interactive plotting of interpolated precipitation over 9 days.
- Exploring precipitation data with Python.
- Define stations location with Folium.
- Plot precipitation values with following methods: Linear, Cubic and Nearest
- Creation of a plot function for interpolation precipitation data.
Module 3: Data visualization in Python
Following the learning process of Python programming for water resources we will develop a course focused on data visualization using different graphical libraries like Matplotlib, Seaborn, Folium and Altair. This module is aimed to learn the creation and control process of plots for an efficient and interactive data analysis.
Session 01: Matplotlib
This session is focused on learning how to use the Matplotlib library that provides blocks to create visualizations for different kinds of data and how to customize them.
- Introduction to Matplotlib.
- Creation of a simple plot using Matplotlib.
- Customizing plots.
- Bar and histogram plots.
- Scatter and 3D scatter plots.
Session 02: Seaborn
Introduction to the Seaborn library and how to visualize chemistry data using Seaborn plots as bars, histograms, scatters and 3D scatters.
- Introduction to Seaborn
- Reading water chemistry data on csv format
- Plotting graphs with Seaborn: Histograms, bar plots, box plots, pair plots and subplots.
Session 03: Folium
We will explore the different capabilities of the Folium library that allows creating maps quickly using a tap water and groundwater dataset.
- Introduction to Folium.
- Markers and creation point maps.
- Processing tap water data and groundwater wells.
- Visualization of geospatial data with multiple popup lines.
Session 04: Altair
In this session, we will learn to create visualizations with the Altair Python library and know how to manipulate and interact with those charts using weather data.
- Introduction to Altair
- Exploring weather data:
- Calculation the total precipitation of each month.
- Visualization of mean and range temperature using bar plot.
- Relationship between weather, precipitation, maximum temperature:
- Configuration to use a larger canvas and to allow interactive panning and zooming with the mouse.
Module 4: Applied geospatial data analysis with Python
Modeling surface flow, groundwater flow or any physical process on the environment is by itself a distributed process where analytical tools need to be combined with geospatial tools on a programming level. We have compiled the basic information and applied examples of the most common geospatial tools available in Python while assuring functionality on any operating system.
Session 1: Introduction to Fiona
Fiona is a Python package for the read and write of ESRI shapefiles and other formars. In this session we will explore the fundamentals of Fiona
- Reading of geospatial data:
- Exploring metadata and geometry
- Working with point and polygon data.
- Creating a composite plot.
- Reading multilayer data.
- Checking format drivers.
- Converting geospatial data:
- Shapefile to geojson.
- Geopackage to geojson.
Session 2: Introduction to Shapely
In this session we will explore the manipulation and analysis of geometries from spatial objects on a cartesian plane with Shapely.
- Creating geometries
- Distinction between constructive (buffer, convex hull) and set-theoretic operations (intersection, union).
- Spatial analysis over elements: flooded schools, highways.
- Saving the results as a shapefile with the corresponding metadata.
Session 3: Raster data management with Rasterio and Python
We will explore Rasterio, a Python package for raster management and analysis, exploring its capabilities for raster read / write, extract metadata, plot and band algebra.
- Reading monoband and panchromatic Tiff images.
- Exploring raster dataset info and attributes.
- Analyzing spatial information.
- Reading raster band data.
- Raster plotting options with Rasterio and Matplotlib.
- Raster algebra example: NDVI vegetation index calculation.
Session 04: Introduction to Geopandas for flooded areas analysis
This session will cover an analysis of flooded areas impact on infrastructure with Python and Geopandas. The exercise will show how Geopandas can manage both the spatial analysis and operation among columns.
- Reading data into Geopandas.
- Working with linestrings and points.
- Spatial operation.
- Plotting data with Folium.
- Clipping and exporting flooded areas.
Module 5: Machine learning with Python for water resources
Algorithms of machine learning in Python are simple and efficient tools for predictive data analysis and can be applied to any field of water resources. We have developed some applied cases of machine learning prediction with the Scikit Learn and Scikit Image of a variety of topics that range from water chemistry, fill missing precipitation, and water bodies delineation.
Session 1: Filling missing precipitation data
Implementation of different methods in Python to fill gaps in precipitation or other water related variables such as simple AA, normal ratio, multi-linear regression, and neural networks.
- Simple Arithmetic Average (AA)
- Multiple linear regressions
- Neural networks
Session 2: Fill missing precipitation from multiple stations and climate variables
This session shows an applied procedure to run a complete script for the filling of missing precipitation in one station by the use of data from multiple stations and climate variables.
- Multiple clips to stations data.
- Exploring station and climate variables.
- Creation of a plot function for visualizing the temporal distribution of climate variables.
- Generation of a neural network.
Session 3: Water chemistry cluster analysis
This session will apply the Principal Component Analysis algorithm to a set of water chemistry data extracted from a tabular file and will perform dendrograms.
- Reading data into a pandas dataframe.
- Describing component samples.
- Principal Component Analysis (PCA) using Scikit-Learn
- Performing hierarchical clustering:
- Treating each data as one cluster.
- Forming a cluster by joining the two closest data.
- Plotting a dendrogram to divide into multiple clusters.
Session 4: Delimitation of water bodies with Canny filters
This session will use Python together with Scikit Learn and geospatial libraries to delineate water bodies and provide results as a vector spatial file.
- Importing required packages.
- Reading bands.
- Canny filter.
- Exporting edges as geospatial shapefile
Trainer
Saul Montoya M.Sc.
Hydrogeologist - Numerical Modeler
Mr. Montoya is a Civil Engineer graduated from the Catholic University in Lima with postgraduate studies in Management and Engineering of Water Resources (WAREM Program) from Stuttgart University – Germany with mention in Groundwater Engineering and Hydroinformatics. Mr Montoya has a strong analytical capacity for the interpretation, conceptualization and modeling of the surface and underground water cycle and their interaction.
He is in charge of numerical modeling for contaminant transport and remediation systems of contaminated sites. Inside his hydrological and hydrogeological investigations Mr. Montoya has developed a holistic comprehension of the water cycle, understanding and quantifying the main hydrological dynamic process of precipitation, runoff, evaporation and recharge to the groundwater system.
Over the last 9 years Saul has developed 2 websites for knowledge sharing in water resources: www.gidahatari.com (Spanish) and www.hatarilabs.com (English) that have become relevant due to his applied tutorials on groundwater modeling, spatial analysis and computational fluid mechanics.
Methodology / Examination
Mode: Online with streaming - Synchronous
Some details about the diploma methodology:
- Manuals and files for the exercises will be delivered on our online platform.
- The course will be developed by video streaming with live support and interaction, recorded videos will be available on our elearning platform.
- There is online support for questions regarding the exercises developed through email and meets.
- Video of the classes will be available for 12 months.
The exams and certification are organized as follows:
- The program has 2 exams that comprise the content of 2 or 3 courses.
- Digital certificate available at the end of the program upon the exam approval.
Date and time
The course consists of sessions lasting approximately 1 to 1.5 hours, all starting at 6:00 PM Central European Time (CET) - Amsterdam Time
Module 1
20, 22, 27, 29 October 2026
Module 2
3, 5, 10, 12 November 2026
Module 3
24, 26 November 2026
1, 3 December 2026
Module 4
8, 10, 15, 17 December 2026
Module 5
5, 7, 12, 14 January 2027
Cost
This is the list of prices and discounts:
- 47% Discount if you pay before August 1: $450 USD
- 30% Discount if you pay before September 1: $595 USD
- 15% Discount if you pay before October 1: $750 USD
- Normal Price: $850 USD